March 10
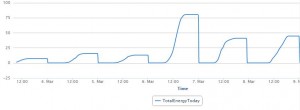
For those curious about solar output in the Commons, below is a graph of the production during the last week. The last day of the net zero energy week was helped by a huge increase in solar output. It’s interesting how much solar output can vary by day.
December 4
For weeks now, I’ve been meaning to set the temperature schedule on my thermostat at home. Like many other items, it sits on my to-do list not addressed. So many days, I manually adjust the temperature because the schedule that is set is problematic. The Commons has a temperature schedule as well. Because of the VRF system installed, each space in the building has its own heating and cooling schedule. Thus, one room can be on cooling at the same time another is on heating, and they can have different set temperatures. The system uses a heating loop so that one room can use heat energy not being used from another room.
Our current temperature schedule is not ideal. The first project for the living building class this trimester is to collaborate with teachers to set a schedule that is both comfortable for learning and more energy efficient. While setting temperature schedules might not be quite as exciting as debating current events or constructing a guitar, but it is a great example of an assignment that utilizes critical thinking and collaborative skills. Also, it is an example of student work having a concrete purpose and value. Not only will students be setting the actual temperature schedule in the building, by coming up with a more energy efficient plan they are saving energy and money.
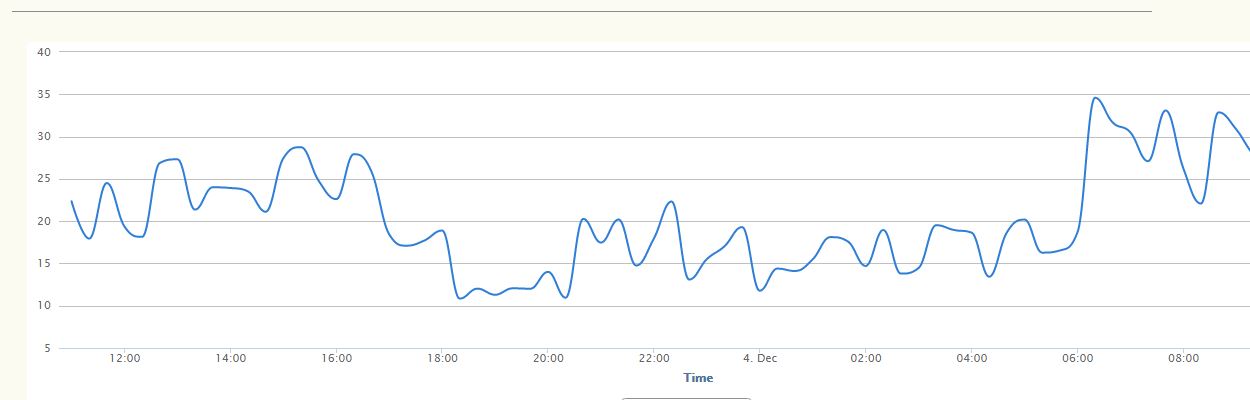
Below is an image of power use in the building in the last 24 hours. During the night, power use was always between 10-20 kW, which seems pretty high. Our class will get this value smaller while still ensuring that the Commons is comfortable place to be.
November 24
I think statistics are interesting even when they just verify our conjectures based on intuition and experience. There is enough in life that is unpredictable, complex, and confusing. During the school week of October 6-10th, in terms of energy in the Commons we used 698.64 kWh, produced 319.69 kWh through solar and our net energy use was 378.45 kWh. During that week we had very brief time periods in the middle of the day when we actually had negative net power use, amount of solar energy we were generating was greater than the energy we used. Nonetheless, our net energy use was still a significant value, and we need to start figuring out how to get the number smaller. In the week of November 3-7th, we had less solar energy and it was colder in the building so we needed to use more energy for the heating and cooling. Our gross energy use was 824.62 kWh and we produced 165.71, for a net of 656.38 kWh. More than twice the amount in the beginning of October. Are these values ridiculously high? What do they mean in terms of a regular building’s use or one’s home? How can we be more energy efficient? How can we use our passing heating features (solar chimney, skylights) more effectively? All questions for the community, or some group within the community.
November 20
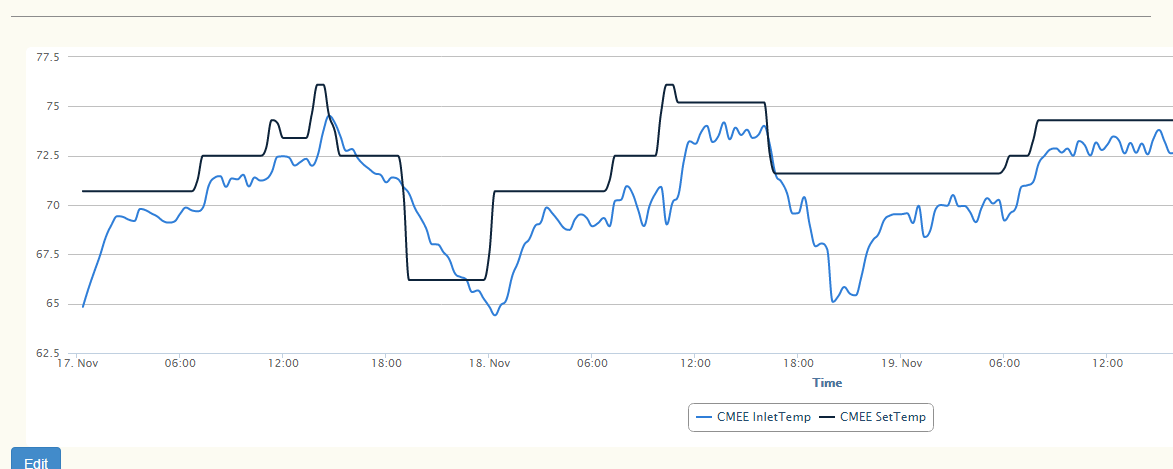
Below is a graph of temperature in the CMEE. The black line is the set temperature, and the blue line is the actual temperature. Notice that in general the actual temperature follows the pattern of the set temp and stays fair close to it. Good news! The heating and cooling units in the Commons (HVAC system) uses variant refrigerant flow (VRF), which is different than most HVAC systems in the US. One idea of the VRF system is that we want to keep the temperatures stable and that it takes less energy to keep them stable that it is for the units to try and hit goal temperatures, then turn off, then work hard to get back to the temperature after it dips again. The Commons team aims to examine what approach to temperature schedules is most efficient.
November 14 – this page will be a blog of running observations about the technology and data in the Commons. I hope the information and observations will prompt interest and feedback from the community.
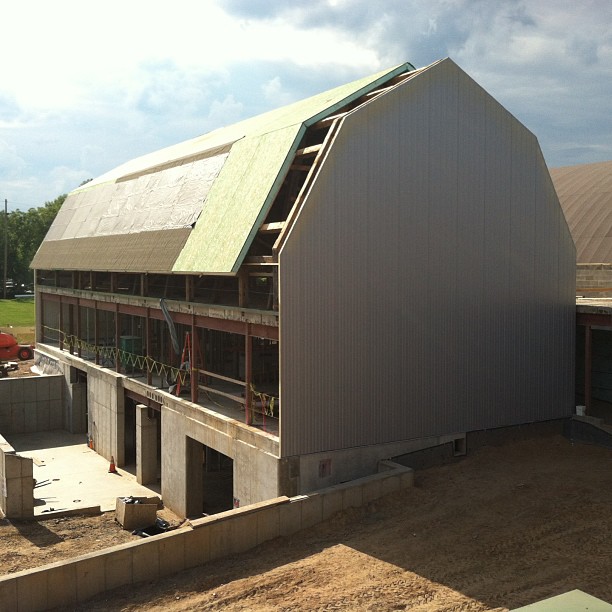
The greenhouse has two solar chimneys, which use solar passive heat to help heat and cool the rooms in the Commons. The graph below is a representation of the temperatures at the top and bottom of the east chimney in the figure.
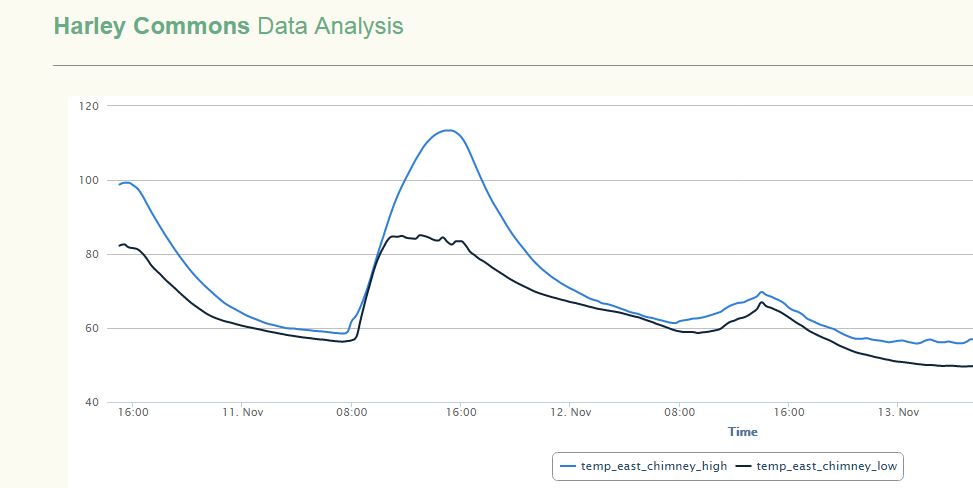
I’m struck by two observations. First, it gets pretty hot in that solar chimney! Over 110 degrees! Second, at times there is a huge temperature difference between the top and bottom of the chimney – over 30 degrees difference even though they are not that far apart.
I’ve wondered how quickly air moves through the chimney. This would affect how quickly the solar chimney could gets or cool a space. I assume air moves more quickly when the temperature difference between top and bottom is greater. I suppose the temperature in the receiving space is also important. Have you experimented with moving air through the chimney under different circumstances ?
Colm and I have been discussing the best ways to test how effectively the solar chimney works. I think we need more pressure difference to get that air moving quicker! There’s a few things to try out with opening and closing doors and using the ERV. In other words, there are different circumstances to experiment with besides the varying weather conditions. It’s on the to-do list!