Guest blog–by Seth O’Bryan
In some ways, graphs are the literature of mathematics, or maybe the graphic novels of mathematics. Graphs tell a story, often quicker than numbers can. At a quick glance, you can begin to see patterns. These patterns prompt questions, and they also help the reader think about relationships among characters, or variables, in a story.
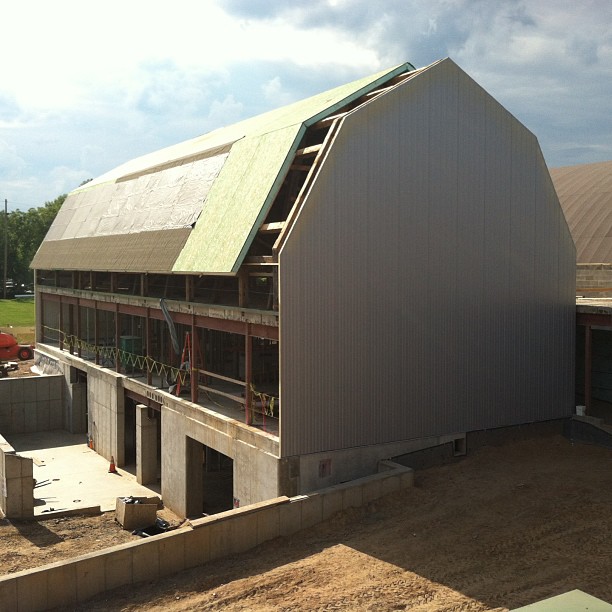
The image below (please click on it for a larger view) contains graphs of the power produced from solar energy in the Commons, power consumed in the Commons, and the net power, which is power used minus power generated. The first thing I observe among the graphs are the repeating patterns. The blue graph is solar output. The curved patterns remind me of the sun’s path in the sky during the day. While patterns can be obvious and intuitive, I think graphs can still make the obvious interesting. Solar ouput peaks right around the time when the sun reaches its highpoint during the day. Also, sure enough, solar energy is zero during the hours we have do not see sunlight. Three of the four days have a very similar pattern of solar output. September 25th has more variability in its curve, which makes me wonder if it was a cloudy or rainy day. We have a weather station on the Commons that allows us to inspect this question.
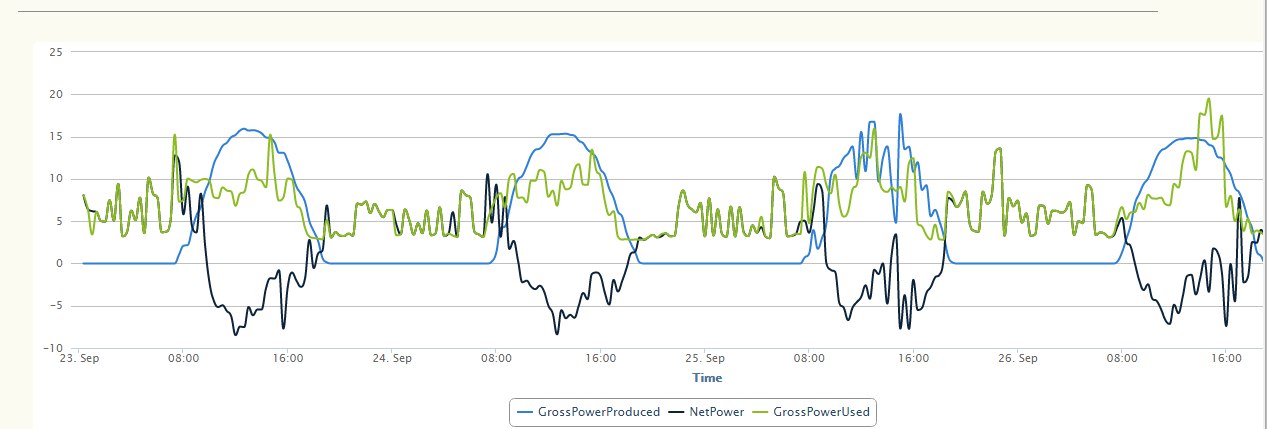
Our energy use seems more erratic and less predictable. However, in general, you can see the power values increase during the school day and overall seem to peak toward the end of the school day. I find myself wondering why the green graph spikes up and down so much. In other words, what specific draws for energy vary up and down so much that the graphs are less smooth than the blue solar graph.
Net power, represented by the black graph, is clearly below zero for the four school days, meaning that we generated more energy than we used. These days are major victories in the net zero energy challenge. At the same time, I find myself wondering if we can be more energy efficient. Should the green power graph have smaller values in the evening and night times?
As is true with most data, my questions and observations about this page in the power story may vary considerably from the questions generated by others exploring the same information. Engaging students and faculty (consumers) in these discussions can only broaden our view of what is possible, while serving to refine and focus our actions.